-
 Full Conference Pass (FC)
-
 Full Conference One-Day Pass (1D)
Date: Friday, December 7th
Time: 2:15pm - 4:00pm
Venue: Hall D5 (5F, D Block)
Session Chair(s): Carol O'Sullivan, Trinity College, Dublin,
Visual Analytics of Big Networks - Novel Approaches for Exploring Networks in Big Data
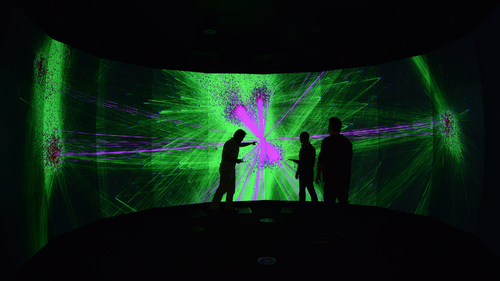
Abstract: Visual Analytics is the science of analytical reasoning facilitated by interactive visual interfaces. It is a multidisciplinary subject that comprises data modelling, information visualisation, knowledge science, and human cognition. It should therefore be considered in a broad interdisciplinary context. This course outlines the fundamentals of Visual Analytics for Big Networks, and illustrates them through applied used cases. It touches on aspects of data integration, visualisation design, simulations, machine learning and combinations of all. We introduce methods that allow exploration and validation of networks through visualisation, statistical models and interactivity to generate new knowledge. The best results can often be achieved through graphical interfaces, which can illustrate patterns and trends in complex networks over time, allowing interactions and re-computations in real-time, acting as a feedback loop for improving Visual Analytics outcomes. However, several elements have to be considered in the design of tools that facilitate Visual Analytics of Big Networks, in order to be effective in extracting and communicating the underlying insights, not only to the scientific community, but also to the public. In this course, we discuss recent approaches towards exploring and analysing Big Networks. Furthermore, we explore the potential of different visualisation modalities, including AR/VR environments. This presents novel opportunities to use the unique properties of immersive environments to facilitate data exploration using combination of machine learning and interactive visualisations to combine the strength of human intuition and power of computation. One example is semi-supervised learning, where the visual presentation is used to determine the best tuning parameters for label propagation. The techniques and elements we focus on include: big graph data integration and representation, multiple views of data, simulations and machine learning, as well as natural user interfaces for Visual Analytics of Big Networks. Furthermore, we discuss the potential of virtual reality/augmented reality and immersive high-performance visualisation platforms.
Authors/Presenter(s): Daniel Filonik, UNSW Art & Design, CSIRO's Data61, Australia
Daniel Filonik, UNSW Art & Design, CSIRO's Data61, Australia
Tomasz Bednarz, UNSW Art & Design, CSIRO's Data61, Australia